Reports and Dashboards (Data Center)
Risk Register gives you a number of reporting options. You can embed a matrix in a dashboard, create a risk report, or display your risks in Confluence.
Creating a dashboard
You can display risk information in a Jira dashboard. Start by creating a new dashboard or editing an existing dashboard (see Configuring dashboards for more information).
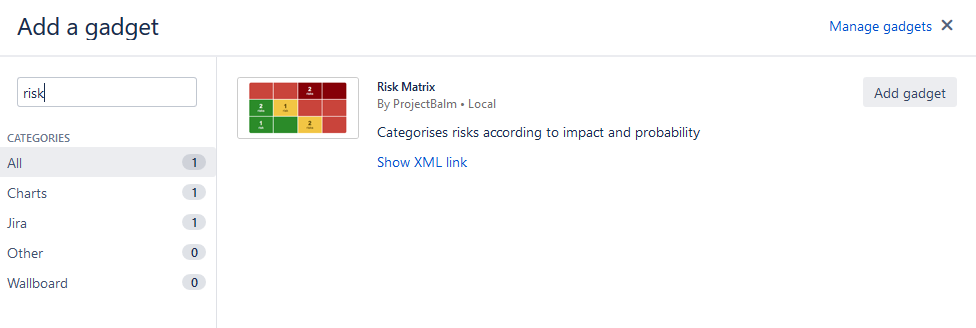
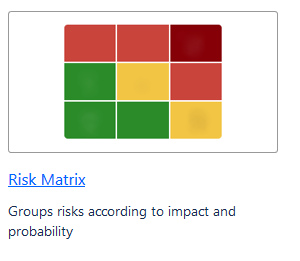
Click on the add a new gadget link and select the Risk matrix gadget.
The gadget settings screen appears when you add the Risk matrix gadget to a dashboard. It contains the following configuration options:
Project or saved filter
Select the project or filter you wish to use.

Exposure basis
Use these radio buttons to indicate whether you want to display original or residual risk in the gadget.

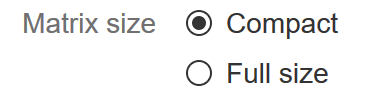
Matrix size
Use these radio buttons to indicate whether you want the matrix to be displayed in full or compact size.
Refresh interval
Indicate how frequently you want the gadget to refresh.

Creating a matrix report
Select the Reports icon on the project navigation bar and select Risk Matrix.
The report configuration page appears, with the following options:
Project or saved filter
Select the project or filter you wish to use.

Exposure basis
Use these radio buttons to indicate whether you want to display original or residual risk in the gadget.

Click Next and the report generates.